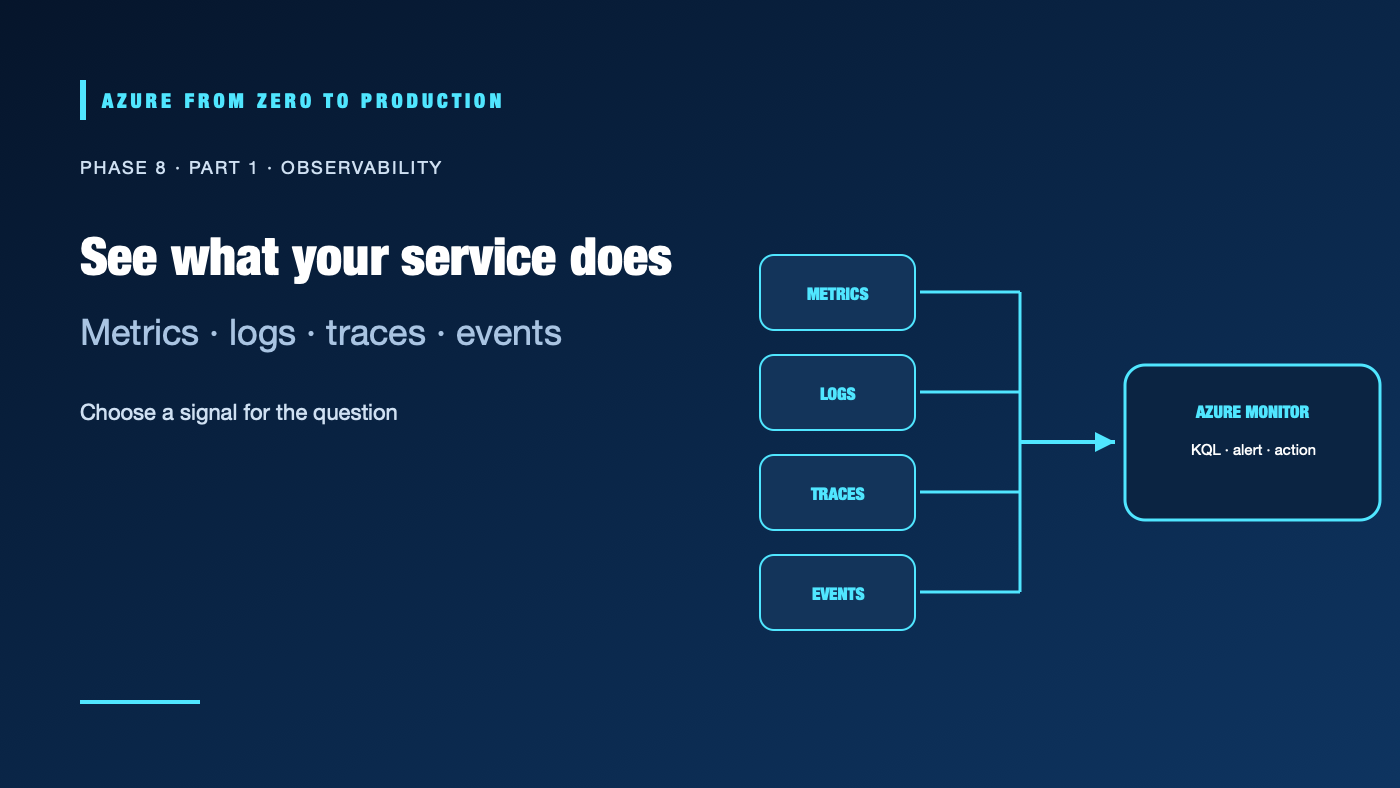
A green deployment only proves that a deployment step completed. It does not prove that users can complete their work, that a dependency is healthy, or that a quiet failure is not accumulating. Azure Monitor brings platform and application telemetry into a common observability workflow. The challenge is to collect enough useful evidence without creating a noisy, expensive, or privacy-invasive data lake.
What you’ll learn
- Distinguish metrics, logs, traces, and events, and choose a signal for a question.
- Explain the roles of Azure Monitor, Log Analytics workspaces, and Application Insights.
- Query application telemetry with Kusto Query Language (KQL).
- Route platform logs with diagnostic settings and data collection rules.
- Control ingestion, retention, sampling, and sensitive-data exposure.
Prerequisites
- Basic Azure resources, resource groups, and application request concepts.
- No subscription is required for the KQL examples.
- A workspace and instrumented application are needed to run the queries.
- Costs depend on ingestion, retention, export, and the Azure services you enable; check current regional pricing before collecting production telemetry.
Start with the operational question
Observability is not a chart collection exercise. Start with a question such as: Are requests failing? Is the database slow? Did a configuration change happen just before the error rate rose? Select the signal that can answer it and decide who will act on the result.
| Signal | What it represents | Useful question |
|---|---|---|
| Metrics | Numeric measurements aggregated over time | Is CPU rising? What is the request failure rate? |
| Logs | Records of discrete events or application activity | Which operation failed, and what result code did it return? |
| Traces | A request’s path across instrumented components | Which dependency added latency to this request? |
| Events | Changes or noteworthy occurrences in a system | Did a deployment, scale action, or configuration update occur? |
These signals complement each other. A metric can show when a symptom began; logs and traces can help explain why. A trace without consistent context propagation may stop at a service boundary. A log without a timestamp, operation identifier, or useful resource metadata can be hard to correlate. Instrumentation and retention should support a named use case, not simply maximize volume.
Understand the Azure Monitor data path
Azure Monitor is the platform for collecting and acting on monitoring data. It includes metrics, logs, alerts, visualization, and collection services. A Log Analytics workspace stores Azure Monitor Logs and is the context in which you run KQL queries. An Application Insights resource provides application performance monitoring and application-focused experiences; modern workspace-based Application Insights stores its telemetry in a linked Log Analytics workspace.
Applications can send traces, metrics, and logs through OpenTelemetry. Application Insights supports OpenTelemetry-based instrumentation for supported languages and frameworks. Platform telemetry has different routes:
- Diagnostic settings select supported platform logs and metrics for a resource and send them to a workspace, storage account, or event hub. Create a setting for each resource that needs collection.
- Data collection rules (DCRs) define collection and transformation for supported agent-based and other data-collection scenarios, such as virtual-machine telemetry.
- Activity Log export is configured at the subscription level when you need that control-plane history in a Log Analytics workspace or another destination.
Do not assume that creating a workspace automatically collects every resource log. Verify the source, collection configuration, destination, table, and permissions for each data path.
Query requests with KQL
KQL is the query language used by Azure Monitor Logs. This example summarizes requests in a workspace using the resource-specific Application Insights table:
AppRequests
| where TimeGenerated > ago(1h)
| summarize
    Requests = count(),
    Failures = countif(Success == false),
    P95DurationMs = percentile(DurationMs, 95)
  by bin(TimeGenerated, 5m), Name
| order by TimeGenerated desc
AppRequests is the resource-specific table name. Older or different workspace configurations can use legacy table names such as requests; check the table schema in the workspace before adapting a query. Filter by time early, project only useful columns, and summarize before building broad dashboards. Queries scan data and can have cost and performance implications.
Use the Application Insights transaction details and operation identifiers to move from a failed request to related dependencies and traces. Avoid copying arbitrary user input into telemetry. Redact tokens, passwords, personal information, and request bodies unless a documented, reviewed need justifies collecting specific fields.
Configure collection deliberately
- List the decisions the telemetry must support: alerting, incident investigation, audit, capacity planning, or product analysis.
- Select sources and destinations. Separate data with different owners, access requirements, or retention needs.
- Configure diagnostic settings or DCRs at the source. Confirm that the category exists for that resource type and region.
- Verify that records arrive in the expected workspace and table. Use a short time range during initial testing.
- Restrict workspace access with Azure RBAC and, where needed, table-level controls. Review who can query sensitive records.
- Document the retention and deletion requirements and test that the configuration meets them.
Keep telemetry useful and affordable
Ingestion volume, retention beyond included allowances, export, and some query patterns affect cost. Keep a budget by source and table; inspect ingestion trends before broadening diagnostics. Choose sampling thoughtfully: it reduces volume, but sampled traces can hide rare failures or distort naive counts. Prefer unsampled counters or metrics for exact volume measurements where required, and document which data is sampled.
Set retention to the shortest period that still meets the operational, audit, and legal need. Do not retain all telemetry indefinitely “just in case.” Use data minimization, redaction, access review, and a documented incident-evidence process. Cost controls should not silently discard the only signal for a critical user journey; test collection and alert behavior after changes.
Choose the next step
- Use metrics for fast, low-cardinality trends and threshold alerts.
- Use logs for investigation, flexible queries, and structured evidence.
- Use traces to follow a transaction through distributed dependencies.
- Use Activity Log and resource logs when you need a record of platform changes or service-specific operations.
- Use Application Insights when you need an application-focused view of requests, dependencies, exceptions, and distributed transactions.
✅ Checkpoint: For one service, name its key user-facing SLI, the telemetry source that measures it, the workspace/table that stores the evidence, its retention owner, and the person who responds to a threshold breach.
Next: Audit and troubleshoot Azure failures.
Series navigation: Previous: Phase 7 CI/CD and DevOps · Current: Phase 8, Part 1 · Next: Audit and troubleshoot Azure failures