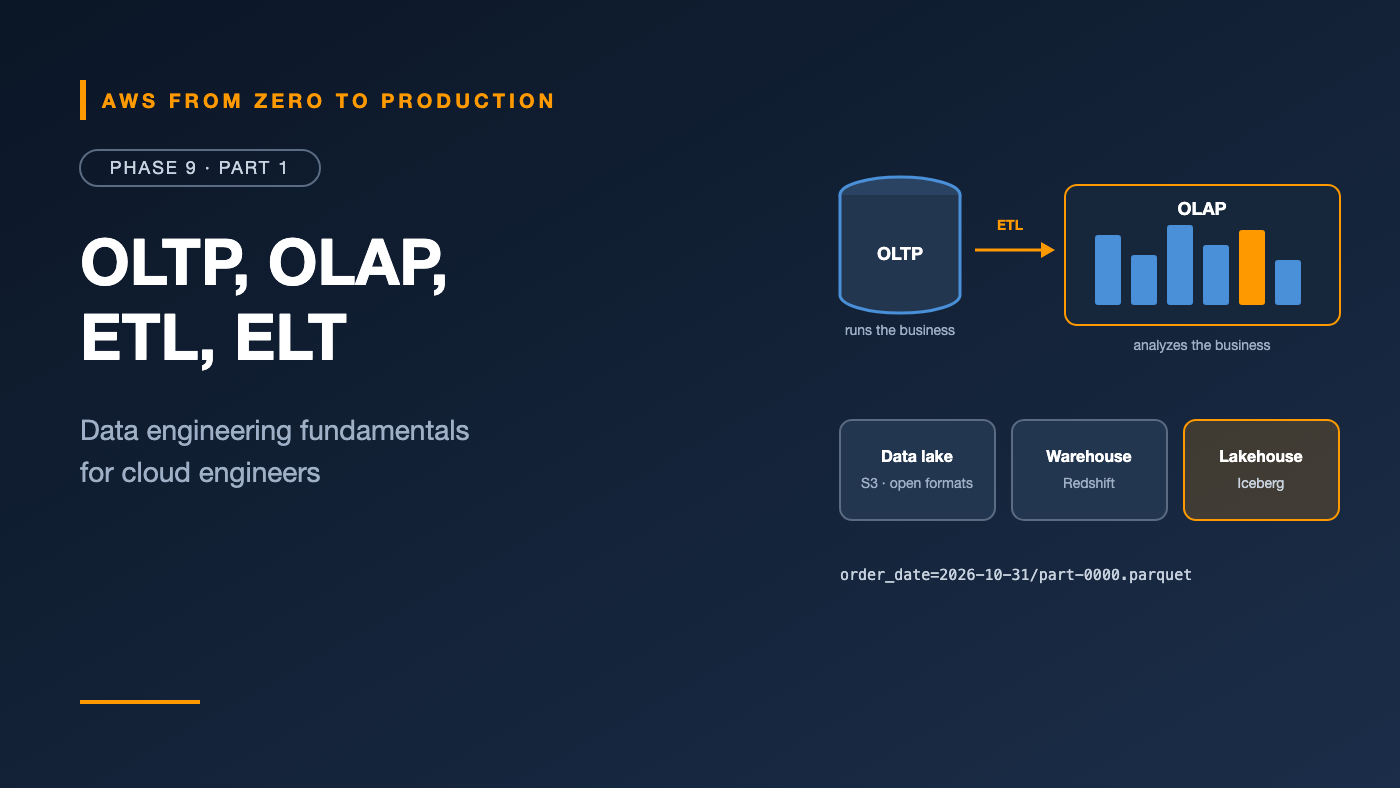
AWS from Zero to Production — Phase 9, Part 1 of 11 · See the full series roadmap
The product manager asks a simple question: “How many orders did we get from returning customers last month, by region?”
The orders database knows the answer. But running that query on the production database at 10 a.m. slows down checkout for everyone. The customer data lives in a different system. The region mapping is in a spreadsheet. And half the numbers disagree with the finance report.
That’s the problem data engineering solves: getting data out of the systems that run the business and into a shape that helps people understand it — reliably, securely, and at scale.
This is the start of the longest phase in the series, and the one this whole path has been building toward. Let’s begin with the vocabulary.
What you’ll walk away with
- 🧱 Structured, semi-structured, and unstructured data
- ⚖️ OLTP vs. OLAP
- ⏱️ Batch vs. stream processing
- 🔄 ETL vs. ELT
- 🏞️ Data lakes, data warehouses, and the lakehouse
- 🗂️ Partitioning and file formats
- 🧬 Schema evolution, data quality, lineage, and governance
Three kinds of data
- Structured: rows and columns with a fixed schema — database tables, CSV files.
- Semi-structured: self-describing, with flexible structure — JSON, XML, Avro, logs, event payloads.
- Unstructured: no inherent schema — images, PDFs, audio, video, free text.
Modern platforms handle all three. Structured and semi-structured data feed analytics. Unstructured data increasingly feeds machine learning and generative AI (Phase 11).
OLTP vs. OLAP
OLTP — online transaction processing
The databases that run the business:
- Many small, fast reads and writes: “insert this order,” “update this customer.”
- Row-oriented storage, normalized schemas.
- Strong consistency and transactions.
- Examples: RDS PostgreSQL, Aurora, DynamoDB — Phase 5.
OLAP — online analytical processing
The systems that analyze the business:
- Fewer, much bigger queries: “sum revenue by region by month for three years.”
- Columnar storage, so a query reads only the columns it needs.
- Optimized for scanning and aggregating huge amounts of data.
- Examples: Amazon Redshift, Amazon Athena on S3.
OLTP: SELECT * FROM orders WHERE order_id = 'A17';         -> 1 row, milliseconds
OLAP: SELECT region, SUM(total) FROM orders GROUP BY region; -> billions of rows scanned
Rule: Don’t run heavy analytics on your production OLTP database. Copy the data to an analytics system — that’s what data pipelines are for.
Batch vs. stream processing
Batch
- Process data in chunks on a schedule: hourly, nightly.
- Simpler to build, test, and re-run.
- Latency: minutes to hours.
- AWS: AWS Glue, Amazon EMR, Athena, Redshift.
Streaming
- Process events continuously, as they arrive.
- Harder: ordering, late data, exactly-once concerns, state.
- Latency: seconds or less.
- AWS: Amazon Kinesis, Amazon MSK, Amazon Managed Service for Apache Flink, Lambda.
Most organizations need both. Start with batch unless the business genuinely needs fresh data in seconds — fraud detection, real-time dashboards, alerting.
ETL vs. ELT
ETL — extract, transform, load
Source -> extract -> TRANSFORM (on a processing engine) -> load -> Warehouse
Data is cleaned and shaped before it lands in the target. Traditional, and still common when transformations are heavy or sensitive data must be removed early.
ELT — extract, load, transform
Source -> extract -> load raw -> Lake or Warehouse -> TRANSFORM with SQL inside it
Raw data lands first; transformations run inside the warehouse or lake, usually in SQL. Popular because storage is cheap, compute is elastic, and raw data stays available for reprocessing. Tools like dbt follow this model.
In practice, most platforms mix both.
Data lakes, warehouses, and lakehouses
Data lake
- A central store for all data, in open formats, at any scale — usually Amazon S3.
- Schema-on-read: apply structure when you query.
- Cheap, flexible, and great for ML and exploration.
- Risk: without governance, it becomes a data swamp.
Data warehouse
- A database optimized for analytics — Amazon Redshift.
- Schema-on-write: data is modeled before loading.
- Fast, consistent SQL for BI and reporting.
- Traditionally more expensive per TB, and less flexible for raw or unstructured data.
Lakehouse
- Combines both: open table formats — like Apache Iceberg — on S3 add warehouse features to the lake: ACID transactions, schema evolution, time travel, and efficient updates and deletes.
- Multiple engines — Athena, Redshift, EMR, Glue — query the same data.
On AWS: S3 for storage, the Glue Data Catalog for metadata, Lake Formation for permissions, and Athena, Redshift, EMR, and Glue as engines — all sharing one copy of the data.
Data partitioning
Partitioning splits a dataset into folders by a column — usually date:
s3://acme-lake/curated/orders/order_date=2026-10-29/part-0000.parquet
s3://acme-lake/curated/orders/order_date=2026-10-30/part-0000.parquet
s3://acme-lake/curated/orders/order_date=2026-10-31/part-0000.parquet
A query with WHERE order_date = '2026-10-31' reads one folder instead of all of them. That’s partition pruning, and on Athena it directly cuts cost — you pay per byte scanned.
Choose partition keys that:
- Match how people filter — usually date, sometimes region or tenant.
- Produce reasonably sized partitions — not millions of tiny ones.
Data formats
Row-oriented
- CSV — simple and universal, but no types, poor compression, slow to query.
- JSON — flexible and readable, but verbose and slow to scan.
- Avro — compact binary rows with an embedded schema. Great for streaming and data exchange.
Columnar
- Parquet — the default for analytics on AWS. Excellent compression; queries read only the columns they need.
- ORC — similar to Parquet, popular in the Hive ecosystem.
Same 10 GB of CSV:
  as Parquet + Snappy    ~1–2 GB
  query 2 of 30 columns  reads a fraction of that
Rule of thumb: Land raw data in whatever format the source gives you. Convert to Parquet (or Iceberg tables backed by Parquet) for anything people query.
Schema evolution
Sources change. Columns get added, renamed, or change type. Schema evolution is how your pipeline copes:
- Adding a column: usually safe in Parquet, Avro, and Iceberg.
- Renaming or dropping a column: can break downstream queries. Iceberg tracks columns by ID, so renames are safe there.
- Changing a type: dangerous —
inttostringcan break readers.
Protect yourself with:
- Schema registries — like the Glue Schema Registry — that enforce compatibility rules for streaming data.
- Data contracts — agreements with source teams about what can change, and how they’ll notify you.
- Tests that fail the pipeline on unexpected schema changes.
Data quality
Bad data is worse than no data: it produces confident, wrong answers.
Common checks:
- Completeness: are required fields present?
- Uniqueness: are IDs unique?
- Validity: are values in expected ranges and formats?
- Freshness: did today’s data arrive?
- Consistency: do totals match the source?
Run checks in the pipeline, and decide what happens on failure: stop, quarantine bad rows, or alert and continue. AWS Glue Data Quality does this natively (Part 3).
Data lineage
Lineage answers: “Where did this number come from?”
orders (RDS) -> DMS -> raw/orders -> Glue job -> curated/orders -> Redshift -> revenue dashboard
Lineage helps you:
- Trace a wrong number back to its source.
- Know what breaks if a column changes.
- Prove to auditors where sensitive data flows.
Data governance
Governance is the set of rules and controls around data: who owns it, who can access it, how long it’s kept, and how it’s protected.
- Ownership: every dataset has an owner.
- Access control: least privilege, down to columns and rows (Part 10).
- Classification: which data is public, internal, confidential, or PII?
- Retention: how long to keep it, and when to delete it.
- Auditability: who accessed what, and when.
Governance done well enables access — people can find and trust data quickly. Done badly, it’s either a free-for-all or a wall.
The data platform you’ll build in this phase
Source database (RDS)
    |
    v
AWS DMS
    |
    v
Amazon S3 raw zone
    |
    v
AWS Glue ETL
    |
    v
Amazon S3 curated Parquet zone
    |
    +----> Amazon Athena
    |
    +----> Amazon Redshift
    |
    v
CloudWatch monitoring and SNS alerts
Each part of this phase covers one piece. Part 11 builds it end to end.
Common mistakes
- Running analytics on the production database.
- Storing everything as CSV or JSON and paying to scan it forever.
- No partitioning, or partitioning by a column nobody filters on.
- Millions of tiny files (Part 2 explains why that hurts).
- No data quality checks, so bad data silently reaches dashboards.
- A data lake with no catalog, owners, or permissions — a swamp.
Key takeaways
- OLTP runs the business; OLAP analyzes it. Keep them separate.
- Start with batch; add streaming when the business needs seconds.
- ETL transforms before loading; ELT loads raw and transforms in place.
- Lakes are flexible, warehouses are fast, and lakehouses combine both with open table formats.
- Partition by how people filter, and store analytics data as Parquet.
- Quality, lineage, and governance make data trustworthy.
Quick self-check
Test yourself before moving on:
- Which is better for “sum revenue by region over three years”: OLTP or OLAP?
- What’s the main difference between ETL and ELT?
- Why does partitioning reduce Athena costs?
- Why is Parquet preferred over CSV for analytics?
Answers
- OLAP.
- Where transformation happens: before loading (ETL) or inside the target after loading (ELT).
- Queries filtered on the partition column scan less data, and Athena charges per byte scanned.
- It’s columnar and compressed, so queries read only the columns they need.
What’s next
In Part 2, we design the foundation: a data lake on Amazon S3 — zones, prefix design, partitioning, file formats, compression, the small-file problem, lifecycle, encryption, cross-account access, and event-driven pipelines.
What’s your team’s biggest data headache today? Tell me in the comments.