AWS from Zero to Production — Phase 8, Part 5 of 5 · See the full series roadmap
Most dashboards are built the day a service launches, and never looked at again. Forty widgets, half of them broken, none of them answering the question you actually have at 3 a.m.: “Is it us, and where?”
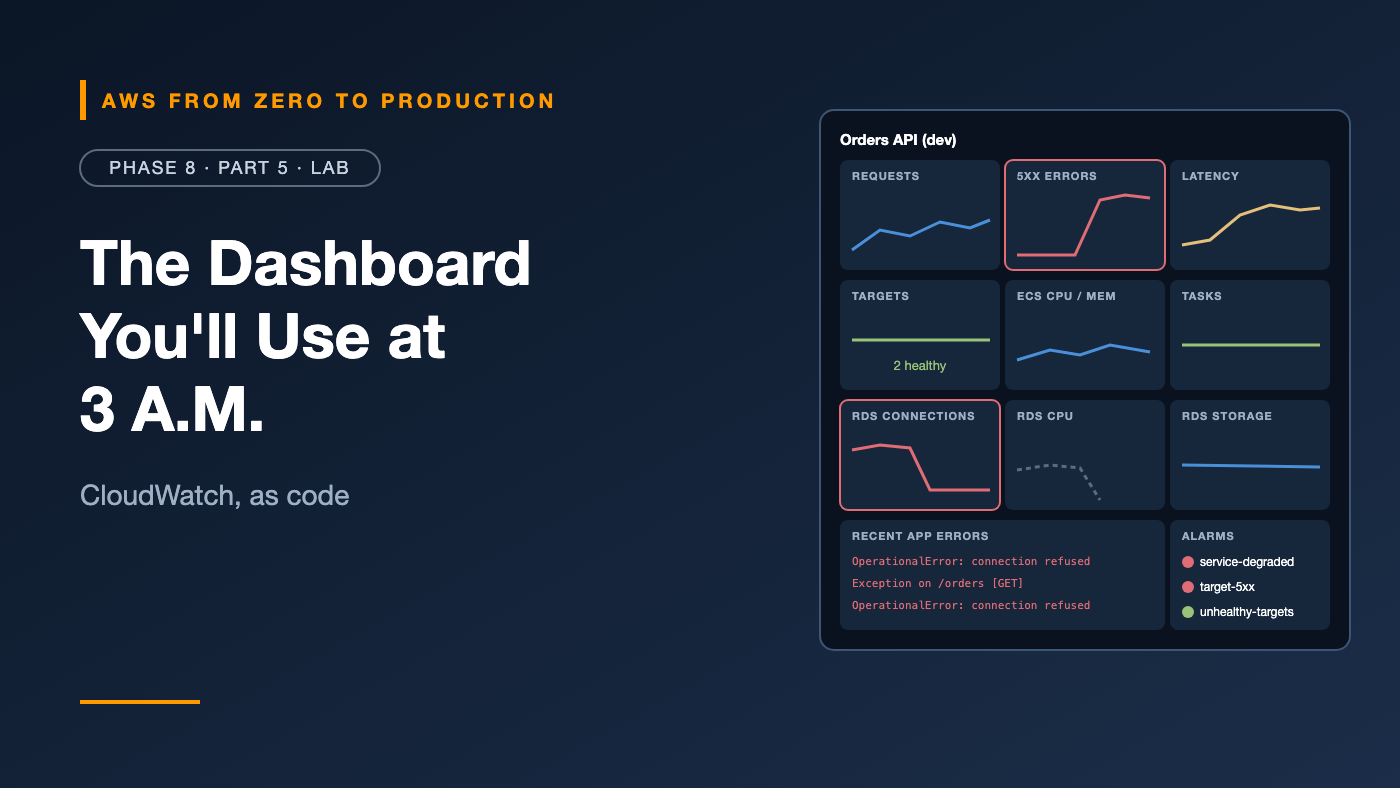
In this lab, you’ll build a dashboard with one job: get you from “something’s wrong” to “it’s the database” in under a minute. It answers the four golden signals — traffic, errors, latency, saturation — for every layer of the stack, plus the app’s own error logs.
And because it’s Terraform, every environment gets the same dashboard automatically.
What you’ll build
- 📦 Container Insights for the ECS cluster
- 🔢 A log-based metric for application exceptions
- 🚨 A composite alarm that pages once for “service degraded”
- 📊 A CloudWatch dashboard with load balancer requests, 5xx errors, and latency percentiles; target health; ECS CPU, memory, and running tasks; RDS CPU, connections, storage, and latency; a live table of recent application errors; and alarm status
- 💥 A realistic failure — and how the dashboard reveals it
+-----------------------------------------------------------------+
|  Orders API (dev) — how to read this dashboard                  |
+---------------------+---------------------+---------------------+
|  Requests           |  5xx errors         |  Latency p50/95/99  |
+---------------------+---------------------+---------------------+
|  Targets healthy    |  ECS CPU / memory   |  Running tasks      |
+---------------------+---------------------+---------------------+
|  RDS CPU            |  RDS connections    |  RDS free storage   |
+---------------------+---------------------+---------------------+
|  Recent application errors (Logs Insights)  |  Alarm status     |
+---------------------------------------------+-------------------+
Prerequisites
- The Phase 6 or Phase 7 Terraform stack — the
infrafolder — deployed and working, with the orders API reachable at its ALB URL - Terraform 1.11+, the AWS CLI, and a bash or zsh terminal
- About 60 minutes
Cost note: Dashboards, a few alarms, Container Insights, and a metric filter add a small monthly cost on top of the running stack. Logs Insights queries are billed by data scanned. Stopping and starting the database in Step 7 costs nothing extra. Destroy the stack when you’re done.
Step 1: Turn on Container Insights
In infra/ecs.tf, add a setting to the cluster:
resource "aws_ecs_cluster" "main" {
  name = local.prefix

  setting {
    name  = "containerInsights"
    value = "enabled"
  }
}
This publishes cluster, service, and task metrics — including running task count — to the ECS/ContainerInsights namespace.
Want more depth? The value
enhancedturns on Container Insights with enhanced observability, for container-level detail, at a higher cost.
Step 2: Turn exceptions into a metric
When the Flask app hits an unhandled error, it logs a line starting with Exception on. Create infra/observability.tf:
resource "aws_cloudwatch_log_metric_filter" "app_exceptions" {
  name           = "${local.prefix}-app-exceptions"
  log_group_name = aws_cloudwatch_log_group.app.name
  pattern        = "\"Exception on\""

  metric_transformation {
    name          = "AppExceptions"
    namespace     = "Orders/App"
    value         = "1"
    default_value = "0"
  }
}

resource "aws_cloudwatch_metric_alarm" "app_exceptions" {
  alarm_name          = "${local.prefix}-app-exceptions"
  alarm_description   = "The app is logging unhandled exceptions"
  namespace           = "Orders/App"
  metric_name         = "AppExceptions"
  statistic           = "Sum"
  period              = 60
  evaluation_periods  = 5
  datapoints_to_alarm = 2
  threshold           = 5
  comparison_operator = "GreaterThanThreshold"
  treat_missing_data  = "notBreaching"
}
datapoints_to_alarm = 2 with evaluation_periods = 5 means “2 bad minutes out of the last 5” — so a single blip doesn’t fire it.
Step 3: Add a composite alarm
Right now, one incident could fire three alarms: 5xx errors, unhealthy targets, and exceptions. Combine them into one page.
Add to infra/observability.tf:
resource "aws_cloudwatch_composite_alarm" "service_degraded" {
  alarm_name        = "${local.prefix}-service-degraded"
  alarm_description = "Orders API is degraded. Runbook: <link to your runbook>"

  alarm_rule = join(" OR ", [
    "ALARM(\"${aws_cloudwatch_metric_alarm.alb_5xx.alarm_name}\")",
    "ALARM(\"${aws_cloudwatch_metric_alarm.unhealthy_targets.alarm_name}\")",
    "ALARM(\"${aws_cloudwatch_metric_alarm.app_exceptions.alarm_name}\")",
  ])

  alarm_actions = [aws_sns_topic.alerts.arn]
  ok_actions    = [aws_sns_topic.alerts.arn]
}
Then, in infra/monitoring.tf, remove the alarm_actions and ok_actions lines from alb_5xx and unhealthy_targets. They still change state and appear on the dashboard — but only the composite alarm notifies you.
Why? One clear page — “service degraded,” with a runbook link — beats three overlapping ones. Keep the database alarms separate; they point to a different kind of problem.
Step 4: Build the dashboard
Create infra/dashboard.tf:
locals {
  alb     = aws_lb.main.arn_suffix
  tg      = aws_lb_target_group.app.arn_suffix
  cluster = aws_ecs_cluster.main.name
  service = aws_ecs_service.app.name
  db      = aws_db_instance.main.identifier
}

resource "aws_cloudwatch_dashboard" "main" {
  dashboard_name = "${local.prefix}-overview"

  dashboard_body = jsonencode({
    widgets = [
      {
        type = "text", x = 0, y = 0, width = 24, height = 2
        properties = {
          markdown = "# Orders API (${var.environment})\nTop row: what users feel. Middle: the app tier. Bottom: the database. Check alarms and recent errors last."
        }
      },

      # Row 1: what users feel
      {
        type = "metric", x = 0, y = 2, width = 8, height = 6
        properties = {
          title  = "Requests per minute"
          region = var.region
          stat   = "Sum"
          period = 60
          metrics = [
            ["AWS/ApplicationELB", "RequestCount", "LoadBalancer", local.alb]
          ]
        }
      },
      {
        type = "metric", x = 8, y = 2, width = 8, height = 6
        properties = {
          title  = "5xx errors per minute"
          region = var.region
          stat   = "Sum"
          period = 60
          metrics = [
            ["AWS/ApplicationELB", "HTTPCode_Target_5XX_Count", "LoadBalancer", local.alb, { label = "From app" }],
            ["AWS/ApplicationELB", "HTTPCode_ELB_5XX_Count", "LoadBalancer", local.alb, { label = "From load balancer" }]
          ]
        }
      },
      {
        type = "metric", x = 16, y = 2, width = 8, height = 6
        properties = {
          title  = "Response time (seconds)"
          region = var.region
          period = 60
          metrics = [
            ["AWS/ApplicationELB", "TargetResponseTime", "LoadBalancer", local.alb, { stat = "p50", label = "p50" }],
            ["AWS/ApplicationELB", "TargetResponseTime", "LoadBalancer", local.alb, { stat = "p95", label = "p95" }],
            ["AWS/ApplicationELB", "TargetResponseTime", "LoadBalancer", local.alb, { stat = "p99", label = "p99" }]
          ]
        }
      },

      # Row 2: the app tier
      {
        type = "metric", x = 0, y = 8, width = 8, height = 6
        properties = {
          title  = "Load balancer targets"
          region = var.region
          stat   = "Maximum"
          period = 60
          metrics = [
            ["AWS/ApplicationELB", "HealthyHostCount", "TargetGroup", local.tg, "LoadBalancer", local.alb, { label = "Healthy" }],
            ["AWS/ApplicationELB", "UnHealthyHostCount", "TargetGroup", local.tg, "LoadBalancer", local.alb, { label = "Unhealthy" }]
          ]
        }
      },
      {
        type = "metric", x = 8, y = 8, width = 8, height = 6
        properties = {
          title  = "ECS CPU and memory (%)"
          region = var.region
          stat   = "Average"
          period = 60
          yAxis  = { left = { min = 0, max = 100 } }
          metrics = [
            ["AWS/ECS", "CPUUtilization", "ClusterName", local.cluster, "ServiceName", local.service, { label = "CPU" }],
            ["AWS/ECS", "MemoryUtilization", "ClusterName", local.cluster, "ServiceName", local.service, { label = "Memory" }]
          ]
        }
      },
      {
        type = "metric", x = 16, y = 8, width = 8, height = 6
        properties = {
          title  = "Running tasks"
          region = var.region
          stat   = "Average"
          period = 60
          metrics = [
            ["ECS/ContainerInsights", "RunningTaskCount", "ClusterName", local.cluster, "ServiceName", local.service, { label = "Running" }],
            ["ECS/ContainerInsights", "DesiredTaskCount", "ClusterName", local.cluster, "ServiceName", local.service, { label = "Desired" }]
          ]
        }
      },

      # Row 3: the database
      {
        type = "metric", x = 0, y = 14, width = 8, height = 6
        properties = {
          title  = "RDS CPU (%)"
          region = var.region
          stat   = "Average"
          period = 60
          metrics = [
            ["AWS/RDS", "CPUUtilization", "DBInstanceIdentifier", local.db]
          ]
        }
      },
      {
        type = "metric", x = 8, y = 14, width = 8, height = 6
        properties = {
          title  = "RDS connections"
          region = var.region
          stat   = "Maximum"
          period = 60
          metrics = [
            ["AWS/RDS", "DatabaseConnections", "DBInstanceIdentifier", local.db]
          ]
        }
      },
      {
        type = "metric", x = 16, y = 14, width = 8, height = 6
        properties = {
          title  = "RDS free storage (bytes) and latency (seconds)"
          region = var.region
          period = 300
          metrics = [
            ["AWS/RDS", "FreeStorageSpace", "DBInstanceIdentifier", local.db, { stat = "Minimum", label = "Free storage" }],
            ["AWS/RDS", "ReadLatency", "DBInstanceIdentifier", local.db, { stat = "Average", label = "Read latency", yAxis = "right" }],
            ["AWS/RDS", "WriteLatency", "DBInstanceIdentifier", local.db, { stat = "Average", label = "Write latency", yAxis = "right" }]
          ]
        }
      },

      # Row 4: errors and alarms
      {
        type = "log", x = 0, y = 20, width = 16, height = 7
        properties = {
          title  = "Recent application errors"
          region = var.region
          view   = "table"
          query  = "SOURCE '${aws_cloudwatch_log_group.app.name}' | fields @timestamp, @message | filter @message like /Exception|Error|Traceback/ | sort @timestamp desc | limit 25"
        }
      },
      {
        type = "alarm", x = 16, y = 20, width = 8, height = 7
        properties = {
          title = "Alarms"
          alarms = [
            aws_cloudwatch_composite_alarm.service_degraded.arn,
            aws_cloudwatch_metric_alarm.alb_5xx.arn,
            aws_cloudwatch_metric_alarm.unhealthy_targets.arn,
            aws_cloudwatch_metric_alarm.app_exceptions.arn,
            aws_cloudwatch_metric_alarm.db_cpu.arn,
            aws_cloudwatch_metric_alarm.db_storage.arn
          ]
        }
      }
    ]
  })
}

output "dashboard_url" {
  value = "https://${var.region}.console.aws.amazon.com/cloudwatch/home?region=${var.region}#dashboards/dashboard/${aws_cloudwatch_dashboard.main.dashboard_name}"
}
The layout follows the request path: users at the top, the app tier in the middle, the database below, and evidence at the bottom.
Step 5: Apply
cd infra
export AWS_PROFILE=sandbox
terraform plan -out=tfplan
terraform apply tfplan
terraform output -raw dashboard_url
Review the plan: a cluster setting update, a metric filter, two alarms, two changed alarms, and a dashboard. Nothing should be destroyed.
Open the dashboard URL.
✅ Checkpoint: The dashboard loads with every widget. Some graphs are flat — there’s no traffic yet.
Step 6: Generate traffic
In a second terminal, send a steady stream of requests:
ALB_URL=$(cd infra && terraform output -raw alb_url)

for round in $(seq 1 60); do
  for i in $(seq 1 20); do
    curl -s -o /dev/null "$ALB_URL/orders" &
    curl -s -o /dev/null -X POST "$ALB_URL/orders" \
      -H "Content-Type: application/json" -d "{\"item\":\"load-$round-$i\"}" &
  done
  wait
  sleep 2
done
That’s about 40 requests every couple of seconds for a few minutes.
✅ Checkpoint: After a minute or two, Requests per minute, response time, ECS CPU, and RDS connections all climb. 5xx errors stay at zero. The alarm widget is all green.
Step 7: Break the database
Now simulate a real incident. Stop the database:
aws rds stop-db-instance --db-instance-identifier orders-dev-db
Keep the traffic loop running (start it again if it finished). Stopping takes a few minutes. Watch the dashboard and notice the order in which things change:
- RDS connections drop to zero, and RDS CPU stops reporting.
- 5xx errors from the app jump —
/orderscan’t reach the database. - Recent application errors fills with connection exceptions.
- Load balancer targets stay healthy —
/healthdoesn’t depend on the database (Phase 5’s design decision). - AppExceptions and 5xx alarms go to ALARM, and the composite alarm sends one email.
Now read it like an on-call engineer:
- Users see errors? Yes (top row).
- Is the app tier down? No — tasks are running and healthy (middle row).
- Is the database OK? No — no connections, no metrics (bottom row).
- What does the app say? Connection errors (log table).
Diagnosis: the database is unavailable. You got there without opening a single other console page.
Restore it:
aws rds start-db-instance --db-instance-identifier orders-dev-db
aws rds wait db-instance-available --db-instance-identifier orders-dev-db
✅ Checkpoint: You received one “service degraded” email, then an OK email after recovery. Errors return to zero, and connections come back.
Bonus question: Why didn’t ECS replace the tasks? Because they were healthy. Restarting them wouldn’t have helped — and a health check that depended on the database would have made ECS kill perfectly good tasks in a loop.
Step 8: Explore with Logs Insights
Open CloudWatch → Logs Insights, choose /ecs/orders-dev, and run:
fields @timestamp, @message
| filter @message like /Exception on/
| stats count(*) as exceptions by bin(1m)
| sort @timestamp asc
You’ll see exactly when exceptions started and stopped. Then try:
fields @timestamp, @message
| filter @message like /OperationalError|connection/
| sort @timestamp desc
| limit 20
These are the queries you’d paste into an incident timeline.
Step 9 (optional): Add anomaly detection on traffic
A sudden drop in traffic can mean a broken client, DNS issue, or upstream failure — and fixed thresholds miss it. In the console, open the Requests per minute widget’s metric, choose Graphed metrics → Actions → Anomaly detection, and look at the expected band. It needs some history to learn your pattern, so it’s most useful on long-running services.
Cleanup
If you’re continuing to Phase 9 soon, you can keep the stack — but it costs money every hour. To remove everything:
cd infra
terraform destroy
✅ Final checkpoint: Destroy complete! The dashboard, alarms, and metric filter are removed along with everything else.
Troubleshooting
The Running tasks widget is empty
Cause: Container Insights was just enabled. Fix: wait a few minutes after terraform apply, and confirm the cluster setting is enabled.
The log widget shows “No data”
Cause: no errors yet, or the log group name doesn’t match. Fix: check the SOURCE name and widen the time range.
The composite alarm never fires Cause: the child alarms didn’t reach ALARM, or the SNS subscription isn’t confirmed. Fix: check each child alarm’s state and confirm the email subscription.
stop-db-instance fails
Cause: the instance is in a state that can’t be stopped, such as during a backup. Fix: wait a few minutes and retry.
What you accomplished
- ✅ Built a golden-signals dashboard as code, layered from users to database
- ✅ Enabled Container Insights for task-level visibility
- ✅ Turned log exceptions into a metric and alarm
- ✅ Replaced overlapping pages with one composite alarm
- ✅ Diagnosed a database outage from one screen in under a minute
Quick self-check
Test yourself before moving on:
- Why are the targets still healthy when the database is down?
- What does the composite alarm add over the individual alarms?
- Why is latency shown as p50, p95, and p99 instead of an average?
- Why define the dashboard in Terraform?
Answers
- The
/healthendpoint doesn’t depend on the database, so ECS doesn’t kill healthy tasks. - One notification for “service degraded,” instead of several overlapping ones.
- Averages hide slow requests; percentiles show what your slowest users experience.
- Every environment gets the same dashboard, versioned and reviewed like any other change.
What’s next
Phase 9 is the data engineering specialization: data lakes on S3, AWS Glue, Athena, Redshift, EMR, streaming, orchestration, DMS, and Lake Formation — ending with an end-to-end data platform lab.
What’s on your team’s most-used dashboard? Share a widget idea in the comments.