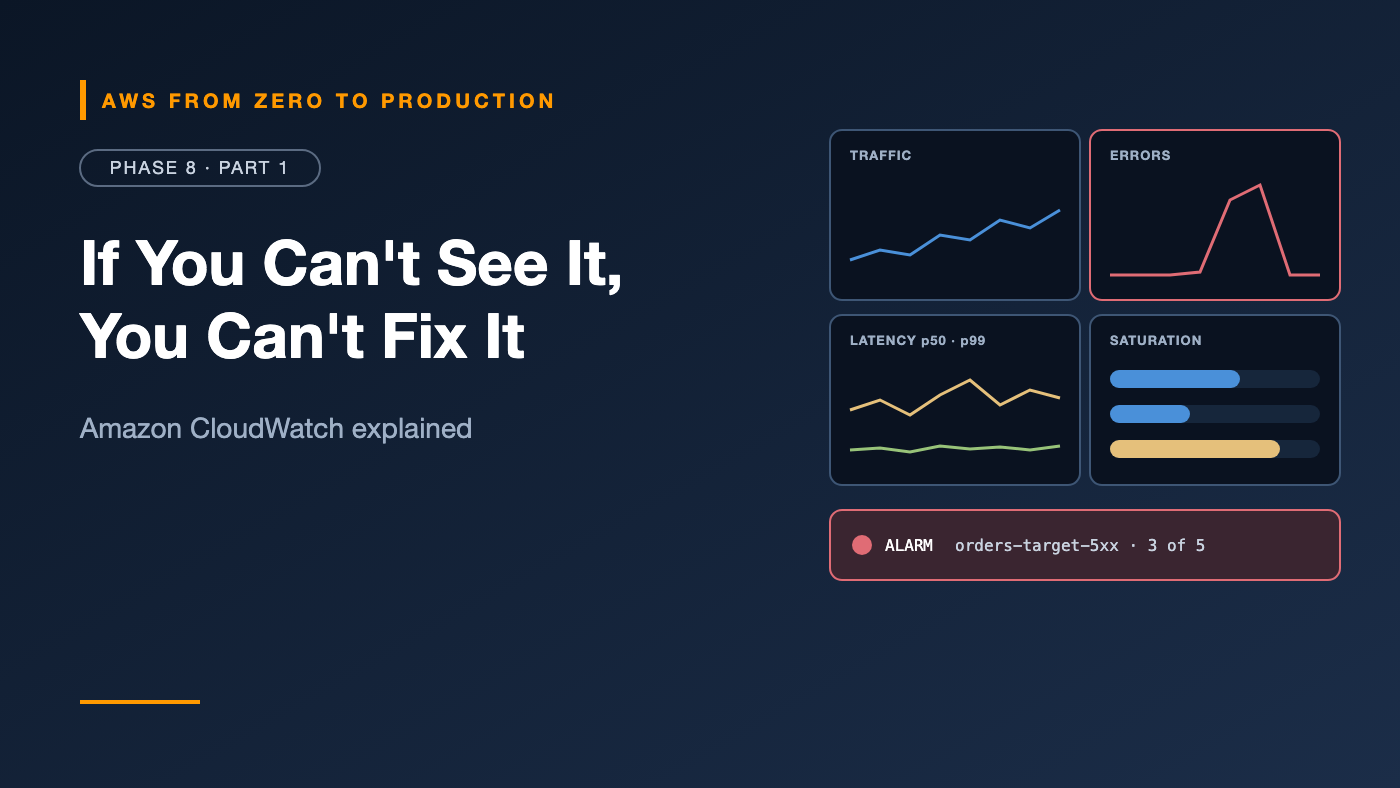
AWS from Zero to Production — Phase 8, Part 1 of 5 · See the full series roadmap
How did you find out about your last production incident?
If the answer is “a customer told us” or “someone noticed on Twitter,” you don’t have a monitoring problem. You have a visibility problem. Your system was telling you something was wrong — in metrics and logs — and nobody was listening.
Amazon CloudWatch is how AWS listens. Every AWS service sends it metrics. Your apps send it logs. And CloudWatch can wake you up, page your team, or trigger automation the moment something drifts.
This article covers the whole toolkit — and how to use it without drowning in noise or cost.
What you’ll walk away with
- 📈 Metrics: namespaces, dimensions, statistics, and custom metrics
- 📜 Logs: log groups, log streams, retention, and metric filters
- 🔎 CloudWatch Logs Insights queries
- 🚨 Alarms, composite alarms, and anomaly detection
- 📊 Dashboards
- 🧰 The CloudWatch agent, Container Insights, and Application Insights
The three signals
Observability usually means three kinds of data:
- Metrics — numbers over time: CPU, request count, latency, errors. Cheap to store, great for alarms and trends.
- Logs — detailed records of events: errors, requests, audit entries. Great for why.
- Traces — the path of a single request across services. Great for where. On AWS, that’s AWS X-Ray and OpenTelemetry.
This article focuses on metrics and logs — the foundation everything else builds on.
Metrics
A metric is a time-ordered set of data points.
- Namespace: a container, like
AWS/EC2,AWS/ApplicationELB,AWS/RDS, or your own, likeOrders/App. - Metric name: like
CPUUtilizationorRequestCount. - Dimensions: name-value pairs that identify which resource, like
LoadBalancer=app/orders-alb/abc123. - Statistics: how data points are combined over a period —
Average,Sum,Minimum,Maximum,SampleCount, and percentiles likep95andp99.
Choose the right statistic
- Requests and errors:
Sum. - CPU and memory:
Average, and sometimesMaximum. - Latency: percentiles. An average hides your slowest users;
p99shows them.
Engineer’s note: If your average latency is 120 ms but your p99 is 4 seconds, one in a hundred requests is painfully slow. On a busy service, that’s thousands of unhappy users an hour.
Resolution and retention
- Most AWS metrics arrive every 1 minute (some every 5 minutes; EC2 basic monitoring is 5 minutes unless detailed monitoring is enabled).
- High-resolution custom metrics can go down to 1 second.
- Metrics are kept for 15 months, with older data aggregated to coarser periods.
Custom metrics
Publish your own business and application metrics:
aws cloudwatch put-metric-data \
  --namespace Orders/App \
  --metric-name OrdersCreated \
  --dimensions Environment=prod \
  --value 1
Or, more efficiently, write Embedded Metric Format (EMF) — structured JSON logs that CloudWatch turns into metrics automatically, with no extra API calls.
Cost tip: Each unique combination of metric name and dimensions is a separate custom metric, billed monthly. Never use high-cardinality values — like user IDs or request IDs — as dimensions.
Logs
- A log event is a single record: a timestamp and a message.
- A log stream is a sequence of events from one source — one container, one instance, one Lambda execution environment.
- A log group is a collection of streams that share settings — like
/ecs/orders-dev.
Retention
By default, logs are kept forever. Set retention on every log group:
aws logs put-retention-policy --log-group-name /ecs/orders-dev --retention-in-days 30
For long-term or compliance storage, export to S3, or use the Infrequent Access log class for logs you rarely query.
Write structured logs
Logs that are JSON are far easier to query:
{"level":"error","msg":"payment failed","order_id":"A17","duration_ms":812,"status":502}
Than this:
ERROR payment failed for order A17 after 812ms (502)
Metric filters
A metric filter turns log patterns into metrics:
aws logs put-metric-filter \
  --log-group-name /ecs/orders-dev \
  --filter-name app-exceptions \
  --filter-pattern '"Exception on"' \
  --metric-transformations \
      metricName=AppExceptions,metricNamespace=Orders/App,metricValue=1,defaultValue=0
Now you can alarm on exceptions in your logs, graph them, and put them on dashboards. For JSON logs, filter patterns can match fields: { $.level = "error" }.
Subscription filters go further, streaming matching log events in real time to Lambda, Kinesis, Amazon Data Firehose, or OpenSearch.
CloudWatch Logs Insights
Logs Insights is an interactive query language for your logs:
fields @timestamp, @message
| filter @message like /Exception|Traceback/
| stats count(*) as errors by bin(5m)
| sort errors desc
For JSON logs, fields are discovered automatically:
fields @timestamp, order_id, duration_ms
| filter level = "error"
| stats avg(duration_ms), pct(duration_ms, 99) by status
- Query multiple log groups at once.
- Save queries for your team.
- Add query results to dashboards.
- Billed by data scanned — narrow the time range and log groups.
Alarms
A CloudWatch alarm watches a metric and changes state when it crosses a threshold:
- OK — within the threshold
- ALARM — breaching
- INSUFFICIENT_DATA — not enough data to decide
The settings that matter
Metric:              HTTPCode_Target_5XX_Count (Sum)
Period:              60 seconds
Threshold:           > 10
Datapoints to alarm: 3 out of 5
Missing data:        treat as not breaching
Actions:             SNS topic -> email, chat, or paging
- Datapoints to alarm (“M out of N”) prevents a single spike from paging someone at 3 a.m.
- Missing data handling matters: for error counts, no data usually means no errors; for heartbeats, no data means something is broken.
- Actions can notify through SNS, scale an Auto Scaling group, stop or reboot an EC2 instance, or trigger Systems Manager.
Alert on symptoms, not causes
Page humans for things users feel: errors, latency, and availability. CPU at 85% isn’t an emergency if users are happy. Send cause-level alarms to dashboards or tickets instead.
Composite alarms
A composite alarm combines other alarms with AND, OR, and NOT:
ALARM("orders-target-5xx") AND ALARM("orders-db-cpu")
Use composite alarms to:
- Reduce noise: one page for “the service is degraded,” instead of five alarms firing at once.
- Add context: only alert when errors and high latency happen together.
- Suppress during maintenance: don’t page while a deployment or maintenance window is running.
Anomaly detection
Some metrics don’t have a good fixed threshold. Traffic at 3 a.m. is very different from traffic at noon.
Anomaly detection learns a metric’s normal pattern — including daily and weekly cycles — and draws an expected band. Alarm when the metric leaves the band:
Alarm when RequestCount is outside the band (2 standard deviations)
Great for traffic drops (“why did orders fall by half?”), which fixed thresholds often miss.
Dashboards
A dashboard puts the metrics that matter on one screen.
A good service dashboard answers four questions at a glance — often called the golden signals:
- Traffic: how much demand?
- Errors: how much is failing?
- Latency: how fast — at p50, p95, and p99?
- Saturation: how full are CPU, memory, connections, and storage?
Tips:
- Put user-facing signals at the top, and dependencies below.
- Add alarm status widgets and a short text widget explaining the service.
- Include a Logs Insights widget for recent errors.
- Define dashboards as code, so every environment gets the same one. You’ll do that in Part 5.
Collecting more data
The CloudWatch agent
EC2 instances don’t send memory or disk usage to CloudWatch by default — the hypervisor can’t see inside the OS. The CloudWatch agent collects:
- Memory, disk, and process metrics
- Log files from the instance
- Custom metrics through StatsD and collectd
Install and configure it with Systems Manager (Phase 6, Part 4), and store its configuration in Parameter Store.
Container Insights
Container Insights collects metrics and logs for ECS and EKS: CPU, memory, network, and storage per cluster, service, task, and container — plus running task counts. Enable it per cluster. Enhanced observability adds deeper, container-level detail.
Application Insights and Application Signals
- CloudWatch Application Insights sets up monitoring for common application stacks — like .NET, SQL Server, and Java — and detects problems automatically.
- CloudWatch Application Signals instruments applications with OpenTelemetry to give you service maps, SLOs, and request-level latency and errors.
Controlling CloudWatch cost
- Set log retention everywhere.
- Avoid debug-level logging in production.
- Avoid high-cardinality custom metric dimensions.
- Narrow Logs Insights queries by time range and log group.
- Use the Infrequent Access log class, or export to S3, for logs you rarely query.
- Review the CloudWatch line on your bill monthly — it creeps up quietly.
Common mistakes
- Logs with no retention.
- Alarming on averages for latency.
- Single-datapoint alarms that page on every blip.
- Paging on causes (CPU) instead of symptoms (errors and latency).
- No alarm on dead-letter queues or missing heartbeats.
- User IDs as metric dimensions.
- Dashboards nobody looks at because they have 60 widgets.
Key takeaways
- Metrics tell you what, logs tell you why, and traces tell you where.
- Use
Sumfor counts, percentiles for latency. - Set log retention, write structured logs, and turn important patterns into metrics.
- Logs Insights answers questions across logs in seconds.
- Alarm on user-facing symptoms with “M out of N”; use composite alarms to cut noise.
- Dashboards should answer traffic, errors, latency, and saturation at a glance.
Quick self-check
Test yourself before moving on:
- Which statistic should you use for latency?
- Your EC2 dashboard doesn’t show memory usage. Why?
- How do you alarm on the number of exceptions written to logs?
- How do you avoid five separate pages for one incident?
Answers
- Percentiles — like p95 and p99.
- Memory isn’t visible to the hypervisor. Install the CloudWatch agent.
- Create a metric filter, then an alarm on the resulting metric.
- Use a composite alarm, and send notifications only from it.
What’s next
In Part 2, we go detective: CloudTrail and CloudTrail Lake, AWS Config, flow logs, load balancer and S3 access logs, RDS logs, ECS service events, the AWS Health Dashboard, and a practical troubleshooting playbook.
What’s the one alarm that’s saved your team the most? Share it in the comments.