AWS from Zero to Production — Phase 8, Part 2 of 5 · See the full series roadmap
It’s 2:14 a.m. The alarm says the orders API is returning 503s.
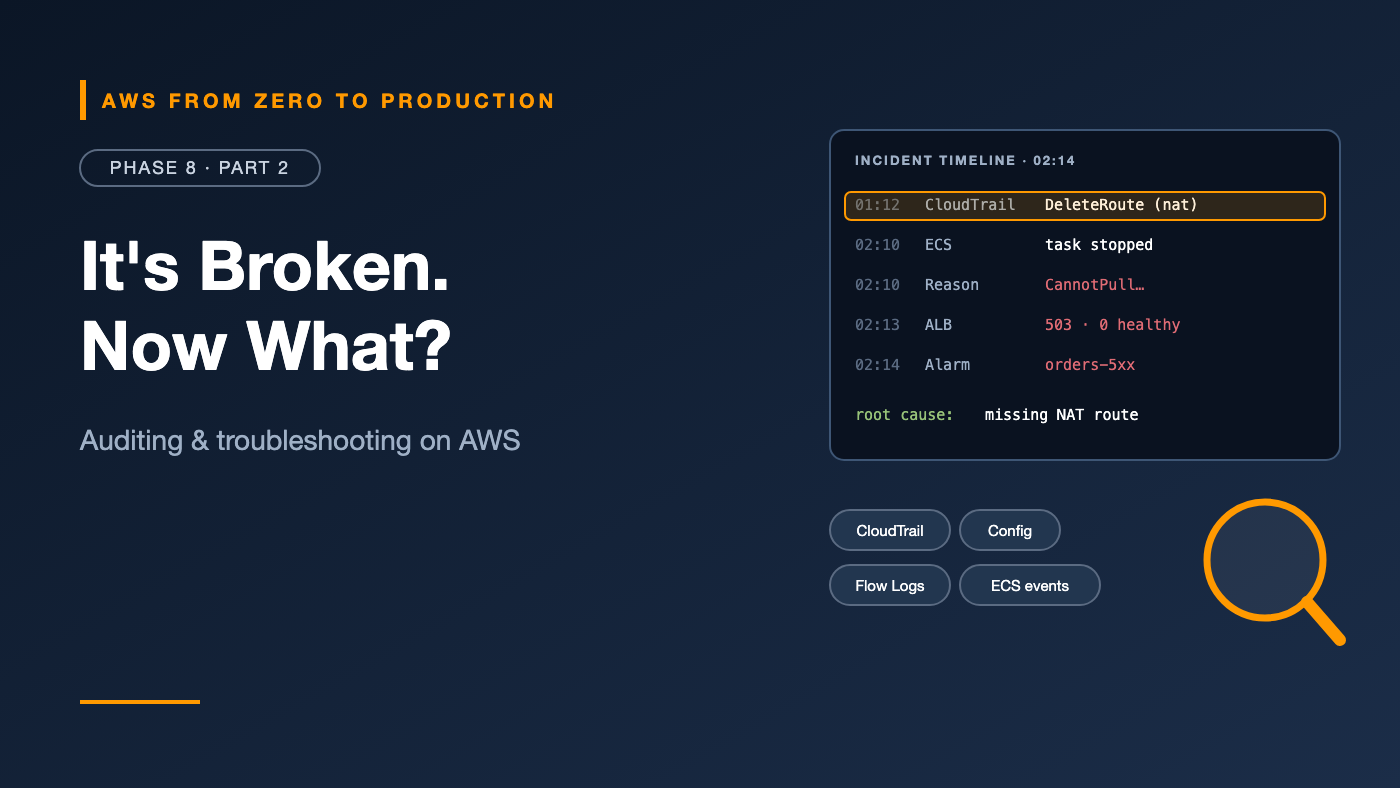
You could start clicking around the console at random. Or you could follow the evidence: the load balancer says there are no healthy targets. ECS service events say tasks are stopping. The stopped reason says CannotPullContainerError. CloudTrail shows someone changed the NAT gateway route an hour ago.
Fifteen minutes from page to root cause — because you knew where AWS keeps the evidence.
This article is a map of that evidence, and a playbook for using it.
What you’ll walk away with
- 🕵️ CloudTrail and CloudTrail Lake — who did what, when
- 🧭 AWS Config — what changed, and what it looked like before
- 🌊 VPC Flow Logs, load balancer access logs, and S3 access logs
- 🐘 RDS logs and database insights
- 📦 ECS service events and stopped task reasons
- 🏥 The AWS Health Dashboard and Support Center
- 🧰 A troubleshooting playbook for common errors
The evidence map
Question                               Where to look
-------------------------------------  -----------------------------------------
Who changed something?                 CloudTrail
What did this resource look like?      AWS Config
Is traffic reaching the resource?      VPC Flow Logs
What did the load balancer see?        ELB access logs, ALB metrics
Who read or wrote this S3 object?      CloudTrail data events, S3 access logs
Why is the database slow?              RDS logs, Database Insights
Why are tasks stopping?                ECS service events, stopped reason
Is AWS itself having a problem?        AWS Health Dashboard
What is my app saying?                 CloudWatch Logs (Part 1)
AWS CloudTrail: who did what
CloudTrail records API calls made in your account — from the console, CLI, SDKs, and other AWS services.
Each event shows:
- Who: the IAM identity — user, role, or federated session
- What: the API action, like
AuthorizeSecurityGroupIngress - When and from where: time, source IP, and user agent
- On what: request parameters and affected resources
- Result: success, or an error code like
AccessDenied
Event history vs. trails
- Event history: the last 90 days of management events, free, in every account.
- Trails: deliver events continuously to S3, and optionally CloudWatch Logs — for long-term retention and alerting. Use an organization trail for all accounts.
- Data events: S3 object reads and writes, Lambda invocations, DynamoDB item operations, and more. Off by default because of volume and cost; enable them selectively.
- CloudTrail Insights: detects unusual API activity, like a sudden spike in
TerminateInstances.
aws cloudtrail lookup-events \
  --lookup-attributes AttributeKey=EventName,AttributeValue=DeleteRoute \
  --start-time 2026-10-31T00:00:00Z \
  --query 'Events[].[EventTime,Username,EventName]' --output table
CloudTrail Lake
CloudTrail Lake stores events in an event data store you can query with SQL, with long retention options:
SELECT eventTime, userIdentity.arn, eventName, sourceIPAddress
FROM <event-data-store-id>
WHERE eventSource = 'ec2.amazonaws.com'
  AND eventName LIKE 'Delete%'
  AND eventTime > '2026-10-30 00:00:00'
ORDER BY eventTime DESC
It’s the fastest way to answer “who deleted things across our accounts last night?” — without building your own pipeline.
AWS Config: what changed
Phase 2 introduced AWS Config for compliance. For troubleshooting, its superpower is the configuration timeline:
- See every version of a resource’s configuration over time.
- See what changed between versions — like an inbound rule added to a security group.
- Linked to the CloudTrail event that caused the change.
- See relationships: which instances use this security group?
Pattern: “It worked yesterday” → open the resource in Config → compare yesterday’s configuration with today’s → follow the link to CloudTrail to see who changed it.
Network evidence
VPC Flow Logs
From Phase 3: flow logs record accepted and rejected traffic per network interface. If a connection times out, look for REJECT records:
fields @timestamp, srcAddr, dstAddr, dstPort, action
| filter dstPort = 5432 and action = "REJECT"
| sort @timestamp desc
| limit 20
A REJECT means a security group or network ACL blocked it. No record at all often means a routing problem — the traffic never got there.
Elastic Load Balancing access logs
ALB access logs record every request: client IP, target, request path, status codes from the load balancer and the target, and timing for each stage.
- Delivered to S3 every few minutes.
- Query them with Athena (Phase 9).
- The timing fields show whether slowness was in the load balancer, the target, or the response.
S3 access evidence
Two options, often confused:
- CloudTrail data events for S3: who called
GetObject,PutObject,DeleteObject— with full IAM identity. Best for security and audit. - S3 server access logs: detailed request logs delivered to another bucket, on a best-effort basis. Cheaper at very high volume, and useful for access pattern analysis.
RDS logs and database insights
- Engine logs: PostgreSQL logs, MySQL error and slow query logs, and SQL Server and Oracle logs. Publish them to CloudWatch Logs to search and alarm on them.
- Enhanced Monitoring: OS-level metrics for the database host, down to 1-second granularity.
- Database Insights (built on Performance Insights): shows database load broken down by wait events, SQL statements, users, and hosts — the fastest way to find which query is hurting you.
- Events: failovers, reboots, maintenance, storage-full warnings. Subscribe through EventBridge or RDS event subscriptions.
For PostgreSQL, log slow queries by setting log_min_duration_statement in your parameter group — for example, to 500 ms.
ECS service events and stopped tasks
When an ECS service misbehaves, two places tell you why.
Service events
The service’s Events tab, or:
aws ecs describe-services --cluster orders-dev --services orders \
  --query 'services[0].events[:10].[createdAt,message]' --output table
Messages like:
service orders was unable to place a task because no container instance met all of its requirementsservice orders has started 2 tasks(service orders) (task abc) failed ELB health checks in (target-group ...)service orders deployment ... deployment failed: tasks failed to start— the circuit breaker
Stopped task reasons
aws ecs list-tasks --cluster orders-dev --desired-status STOPPED \
  --query 'taskArns[:5]' --output text \
  | xargs aws ecs describe-tasks --cluster orders-dev \
      --query 'tasks[].[stoppedReason,containers[0].reason,containers[0].exitCode]' \
      --output table --tasks
Common answers:
CannotPullContainerError— no route to ECR, a wrong image tag, or execution role permissions.ResourceInitializationError— usually fetching secrets or creating the log stream failed.Essential container in task exitedwith exit code 137 — killed for exceeding its memory limit (OOM).- Exit code 1 — the app crashed. Check its logs.
Stopped tasks are only visible for a short time, so check promptly — or capture ECS events with EventBridge.
Systems Manager for troubleshooting
From Phase 6, Part 4:
- Session Manager for a shell — and port forwarding to private databases.
- Run Command to collect diagnostics from many instances at once.
- Automation runbooks like
AWSSupport-TroubleshootSSHandAWSSupport-ExecuteEC2Rescue. - ECS Exec for a shell inside a running container.
- OpsCenter to track operational issues as OpsItems, with related resources and runbooks attached.
AWS Health Dashboard
Sometimes it is AWS.
- The AWS Health Dashboard — service health shows public, Region-wide status.
- Your account health shows events that affect your resources: scheduled maintenance, retiring hardware, certificate expirations, and service issues — with the affected resource IDs.
- Route Health events through EventBridge to Slack, email, or ticketing, so nobody has to watch a page.
- With AWS Organizations, view health events across all accounts.
Check it early. Before spending an hour debugging, spend 30 seconds confirming the problem isn’t an AWS event in your Region.
Support Center
When you need AWS’s help:
- Support plans (Phase 1) determine response times and access to technical support.
- Choose the right severity: “production system down” gets a much faster response than “general guidance.”
- Include the evidence: resource IDs, Region, timestamps with time zones, error messages, request IDs, and what you’ve already tried.
- AWS re:Post and the documentation answer many questions faster than a case.
A troubleshooting playbook
The ALB returns 502
The target closed the connection or sent an invalid response. Check app logs for crashes, and make sure the app’s keep-alive timeout is longer than the load balancer’s idle timeout.
The ALB returns 503
No healthy targets. Check target health, ECS service events, and stopped task reasons.
The ALB returns 504
The target took too long. Check app latency, slow database queries, and calls to downstream dependencies.
The connection times out
Something blocks or misroutes traffic. Walk the path from Phase 3: DNS, route tables, security groups, NACLs. Check flow logs for REJECT.
AccessDenied
Read the full error message — it usually names the action, the resource, and the type of policy that denied it. Check the identity’s policies, resource policies, permissions boundaries, SCPs, and KMS key policies. CloudTrail shows the exact request.
“It worked yesterday”
AWS Config timeline for the resources involved, then CloudTrail for the change, then your deployment history.
General method
- Scope: who’s affected, since when, and how badly?
- Check the obvious: recent deployments, recent changes, the Health Dashboard.
- Follow the request path, hop by hop, using the evidence map.
- Mitigate first — roll back, fail over, scale up — then find the root cause.
- Write it down for the postmortem (Part 3).
Common mistakes
- No organization trail, so CloudTrail history disappears after 90 days.
- Debugging for an hour before checking recent deployments and the Health Dashboard.
- Ignoring stopped task reasons and guessing.
- No flow logs, so you can’t tell “blocked” from “never arrived.”
- Root-causing before mitigating, extending the outage.
- Vague support cases without IDs, timestamps, or errors.
Key takeaways
- CloudTrail answers who did what; CloudTrail Lake lets you query it with SQL.
- Config shows what changed and when, linked to CloudTrail.
- Flow logs and ALB access logs reveal what happened on the network and at the load balancer.
- ECS service events and stopped reasons explain most container failures.
- Check the Health Dashboard early; give Support the evidence they need.
- Mitigate first, then investigate.
Quick self-check
Test yourself before moving on:
- An ALB returns 503 for every request. What’s the most likely cause?
- An ECS task stops with exit code 137. What happened?
- A security group changed overnight. How do you find out who changed it?
- How do you tell whether traffic was blocked or never arrived?
Answers
- No healthy targets in the target group.
- The container was killed for exceeding its memory limit.
- AWS Config timeline, linked to the CloudTrail event.
- VPC Flow Logs —
REJECTmeans blocked; no record suggests a routing issue.
What’s next
In Part 3, we design for failure: RTO and RPO, disaster recovery strategies, multi-AZ and multi-Region patterns, fault injection, AWS Resilience Hub, DR testing, runbooks, and incident management.
What’s the hardest AWS issue you’ve ever debugged? Tell the story in the comments.