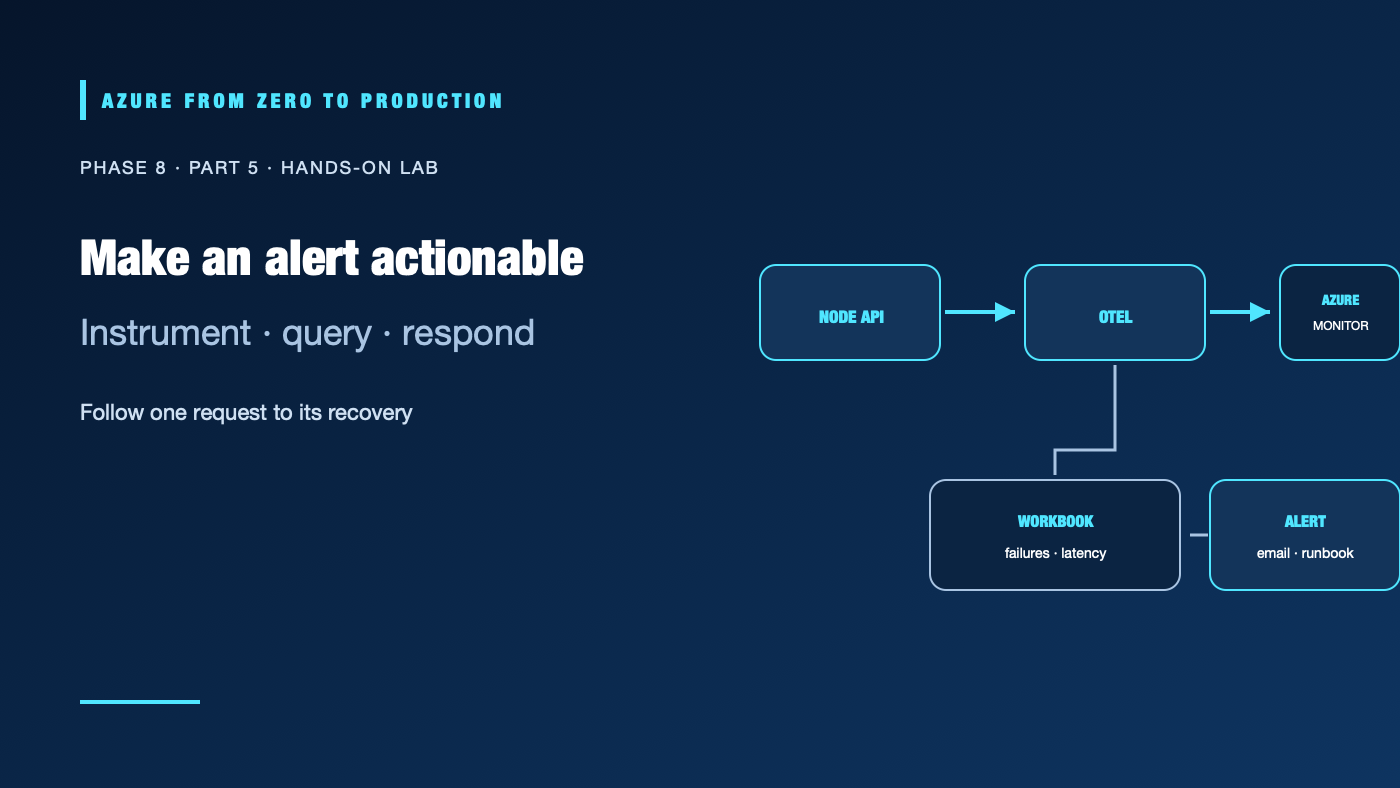
A dashboard is useful only when its data is trustworthy and someone knows what to do when a signal changes. In this lab, a local Node.js API sends request telemetry to a workspace-based Application Insights resource through the Microsoft OpenTelemetry Distro. You will create a workbook for request health, configure a log alert with an email action group, trigger a controlled HTTP 500, and verify the resulting evidence.
This lab creates Azure Monitor, Application Insights, a Log Analytics workspace, a workbook, an alert rule, and an action group. Log ingestion, alert evaluation, and retention can incur charges. Use a disposable development subscription, set a cleanup date, and check current regional pricing. The steps were syntax- and documentation-reviewed; no live Azure deployment or email delivery was tested.
What you’ll build
- A local Node.js API instrumented with OpenTelemetry.
- A workspace-based Application Insights resource and Log Analytics workspace.
- A workbook showing request volume, failures, and latency.
- A scheduled log alert and action group with an email notification.
- A short incident runbook that starts from an alert and ends with a verified recovery.
Prerequisites
- Node.js 22 or later, npm,
curl, Azure CLI 2.91.0+, and access to the Azure portal. - An Azure subscription and permission to create monitoring resources, alert rules, and action groups in a dedicated resource group.
- An email address you can confirm in the action group.
- No production application or personal data; the lab intentionally emits a synthetic failure.
Step 1: Create monitoring resources
In the Azure portal, create a dedicated development resource group in a region that supports the resources you need. Create a Log Analytics workspace, then create an Application Insights resource and associate it with that workspace (workspace-based). Record the Application Insights connection string from its overview page. It identifies the telemetry destination; it is not a substitute for Azure RBAC, but avoid placing it in source control or printing it in logs.
Confirm your identity has the minimum permissions required to create and view these resources. Do not grant subscription-wide Owner merely to complete the lab. If your organization centralizes workspace ownership or requires a pre-approved action group, ask the monitoring administrator to provision those scoped resources.
Step 2: Instrument the sample API
Create a new folder for the lab and initialize a Node.js project. Install the Microsoft OpenTelemetry Distro:
npm init -y
npm install @microsoft/opentelemetry
Create server.js. Initialize telemetry before loading the HTTP library so automatic instrumentation can observe inbound requests:
const { useMicrosoftOpenTelemetry } = require("@microsoft/opentelemetry");

useMicrosoftOpenTelemetry({
  azureMonitor: {
    azureMonitorExporterOptions: {
      connectionString: process.env.APPLICATIONINSIGHTS_CONNECTION_STRING,
    },
  },
});

const http = require("node:http");
const port = Number(process.env.PORT || "8080");

http.createServer((request, response) => {
  if (request.url === "/healthz") {
    response.writeHead(200, { "content-type": "text/plain" });
    response.end("ok\n");
    return;
  }

  if (request.url === "/fail") {
    response.writeHead(500, { "content-type": "text/plain" });
    response.end("controlled failure\n");
    return;
  }

  response.writeHead(200, { "content-type": "text/plain" });
  response.end("service healthy\n");
}).listen(port, "127.0.0.1", () => {
  console.log(`Listening on 127.0.0.1:${port}`);
});
Set the connection string in your shell without committing it:
export APPLICATIONINSIGHTS_CONNECTION_STRING='<connection-string-from-the-portal>'
node server.js
Keep the process in the foreground. In a second terminal, call the health endpoint and then generate one known failure:
curl --fail http://127.0.0.1:8080/healthz
curl --include http://127.0.0.1:8080/fail
The second request should return HTTP 500. Allow a few minutes for telemetry ingestion. In Application Insights or the linked workspace, query recent AppRequests and confirm both the successful and failed request appear. If they do not, check the connection string, exporter initialization order, network egress, resource/workspace association, and the selected time range. Do not add a connection string to command history, a public issue, or a screenshot.
Step 3: Build a workbook
In Azure Monitor, open Workbooks, create a workbook, and add a Logs query using the linked workspace as its data source. Use a time picker and add a table or chart visualization:
AppRequests
| where TimeGenerated > ago(24h)
| summarize
    Requests = count(),
    Failures = countif(Success == false),
    P95DurationMs = percentile(DurationMs, 95)
  by bin(TimeGenerated, 5m), Name
| order by TimeGenerated desc
Save it with a name that includes the workload and environment, for example sample-api-dev-operations. Add a short description with the owner and the decision the workbook supports. Limit access to the intended operators. A workbook is a shared view over telemetry, not an independent retention store.
Step 4: Add a log alert and action
Create an Azure Monitor log search alert rule scoped to the lab workspace. Use this query:
AppRequests
| where TimeGenerated > ago(5m)
| where Success == false
| summarize Failures = count()
| where Failures > 0
Set the condition to trigger when the query returns at least one result. Start with a five-minute evaluation frequency and a matching lookback window for this controlled lab, then select an appropriate warning severity. The query’s time filter and the alert’s evaluation window must agree; verify the portal’s preview and rule settings to avoid an alert that evaluates stale or mismatched data.
Create a dedicated action group with your confirmed email address and associate it with the rule. Use a test action group for the lab, not a shared production group. An alert rule detects a condition; the action group specifies what happens. A fired alert does not guarantee that a recipient saw or acted on it. Check the alert instance, notification delivery status where available, and the recipient inbox.
Step 5: Validate the signal and response
- Query
AppRequestsand verify the/healthzrequest succeeded and/failhasSuccess == false. - Confirm the workbook shows request count, failures, and latency in the expected time bucket.
- Wait for the next alert evaluation and confirm that the rule fired and the action group sent its email. Alert delivery and telemetry ingestion are asynchronous.
- Run
/healthzagain and observe that the failure query returns no new failure after its time window passes. Resolve or close the alert instance according to the portal workflow. - Write down who owns the alert, what users experience, how to find the trace, the first safe mitigation, and the success signal for recovery.
If the alert does not fire, verify the workspace and table scope, query results, rule time range, evaluation frequency, and alert condition. Avoid repeatedly generating failures while debugging; the rule and ingestion pipeline may be delayed.
Response runbook
Alert: sample API request failures
Owner / backup:
Impact and affected environment:
First check: workbook and AppRequests for the alert window
Correlate: operation details, deployment timeline, dependency failures
Safe mitigation:
Stop condition / escalation:
Recovery check: successful user-facing request and no new failures
Evidence: UTC time, alert ID, sanitized operation and deployment IDs
Do not place connection strings, user data, tokens, or request bodies in the workbook, alert description, or incident record. Keep the error route available only in this isolated lab; remove it before using the sample service elsewhere.
Cleanup
Stop the local Node process. In the Azure portal, remove the alert rule, action group, workbook, Application Insights resource, and lab-owned workspace when you have finished reviewing the results. If the resource group contains only these disposable lab resources, deleting that dedicated group is a simpler cleanup path; verify its contents before deletion. Retain neither telemetry nor an unneeded workspace by default.
✅ Checkpoint: Generate one controlled failure, find it in the request table, see it in the workbook, receive the alert notification, and explain the first three steps in your response runbook.
Next: Data engineering fundamentals.
Series navigation: Previous: Azure Well-Architected reviews · Current: Phase 8, Part 5 · Next: Data engineering fundamentals